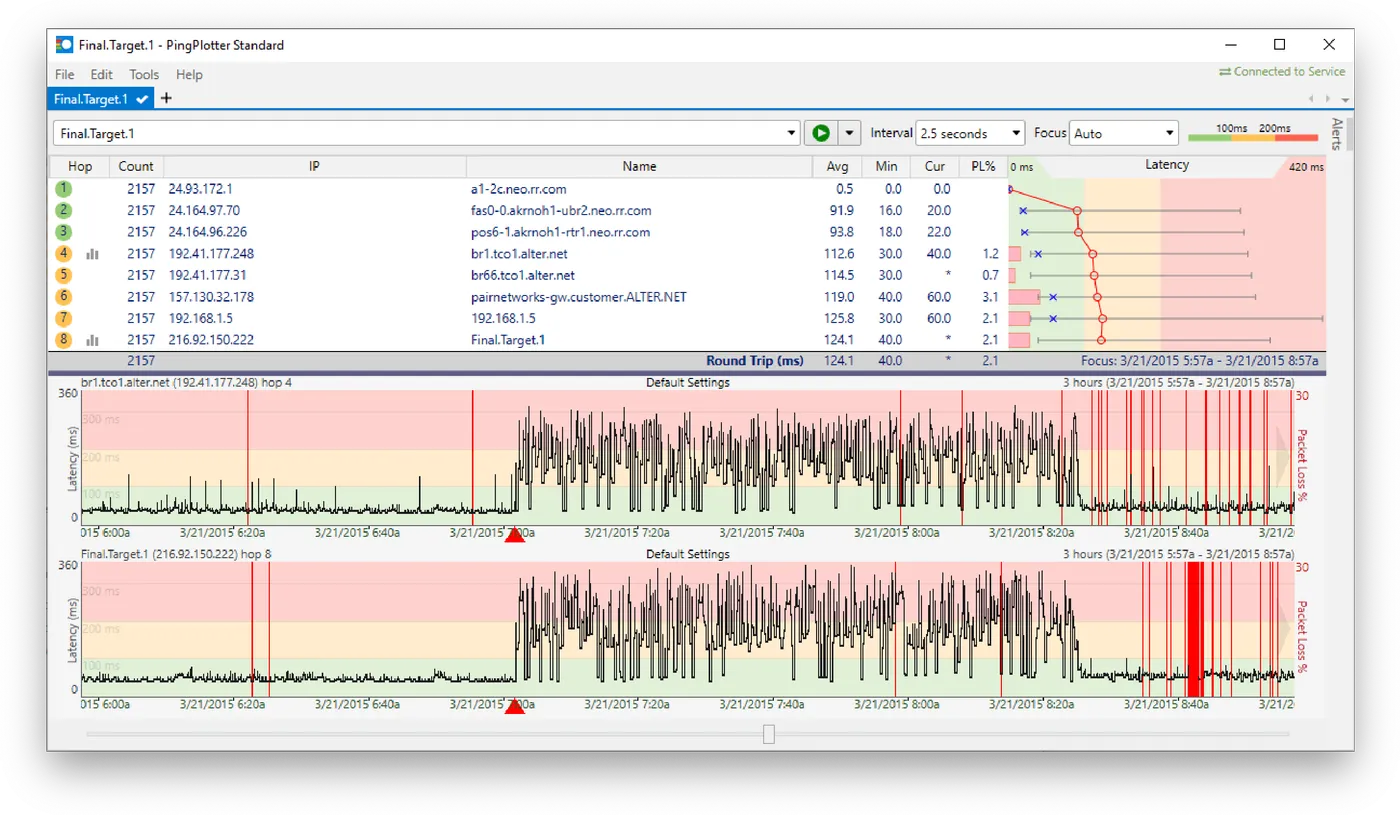
The ticket says “calls drop around 3 p.m. most days.” By the time you open a terminal, the problem is gone, and a single traceroute taken at 10 a.m. proves nothing. What you need is a recording: every hop, sampled continuously, with the bad afternoon captured on a timeline you can scroll back to. That recording is PingPlotter’s whole reason to exist, and it is why it keeps turning up on help desks that field “the internet is slow” tickets.
What PingPlotter actually does
PingPlotter, from Pingman Tools, runs a traceroute to a target, then keeps re-probing every hop on a fixed interval. Each round feeds two views. The trace graph shows the path as a list of hops with minimum, average and current round-trip time plus a packet-loss percentage per hop. The timeline graph plots latency and loss for the final hop (or any hop you select) over time, so a spike at 15:02 lines up visually with the user’s complaint.
Probes can be sent as ICMP echo, or as TCP or UDP packets aimed at a specific port, useful when a firewall or carrier treats ICMP differently. Alerts can fire on thresholds you define, such as loss above a percentage over a window, and the Professional edition adds jitter and MOS-style call-quality figures.
Sessions can be reopened, zoomed and exported as an image or shareable report — the piece that turns a vague ticket into something a carrier’s NOC can act on.
Where it’s strong: evidence in minutes, not hours of explaining
The evidence angle is where PingPlotter earns its licence. A graph that shows loss starting at hop 6 and persisting through every hop after it is readable by a first-line ISP agent who will never look at raw mtr output. The timeline makes correlation obvious: loss that starts at the same minute a backup job kicks off points inward, while loss that rises every evening at 19:00 points at the provider’s upstream.
It also nudges you away from a classic misreading. When an intermediate router shows 40% loss but the hops after it, including the destination, show zero, that router is simply rate-limiting ICMP replies to itself. The layout makes that contrast hard to miss. Our guide on finding the hop where packet loss really starts walks through that reading in detail.
Other practical strengths:
- Multiple targets side by side. Professional allows effectively unlimited targets, so you can trace the gateway, the ISP’s first hop, a SaaS endpoint and a public DNS resolver at once and see which ones degrade together.
- Sample rate down to one second on Professional, useful for short bursts of loss that a 5-minute poller would average away.
Where it falls short, and who should skip it
PingPlotter only sees the path from where it runs. If the machine running it is on Wi-Fi, you are partly measuring the Wi-Fi. Put it on a wired host near the complaint, or you will chase the wrong problem.
It is not a throughput tester. A clean trace with no loss can coexist with a link that tops out at half its rated speed; for that you want iPerf3. Nor does it decode packets — if the question is “why does this TLS handshake stall,” you need Wireshark.
The desktop editions are not Linux-native. Admins who live in a shell and only need a quick look will find mtr does the core trace-and-count job for nothing, from any SSH session. For always-on monitoring across many sites, the desktop product gets awkward; that is PingPlotter Cloud’s job, priced as a separate, larger product.
Who it suits
- Help desk and MSP technicians who need to hand a carrier something they will accept without an argument.
- Remote-work support, where the user’s home connection is the suspect and a graph is easier to discuss than CLI output.
- Small IT teams chasing intermittent VoIP or video-call quality complaints.
Licensing and cost
At the time of writing, the vendor’s pricing page lists four editions. Free traces one target with a short rolling history and no remote data collection. Standard starts at $6.99 per month and covers two targets with alerts and timeline graphs. Professional starts at $29 per month and adds unlimited targets, one-second sampling and jitter measurement. Cloud starts at $90 per month and is a multi-user, agent-based service with dashboards, SSO/SAML and webhooks, with agents for Windows, macOS and Linux.
Standard and Professional are also offered as perpetual licences with volume discounts; the perpetual figure was not published on the pages we checked, so ask the vendor or look at the store directly. Trials run 14 days for the desktop paid editions and 7 days for Cloud. Check the vendor’s current pricing page before budgeting, since plan names and limits change.
How it compares
Against mtr, PingPlotter trades zero cost and shell convenience for history, graphs and a report a non-engineer can read — the full breakdown is in PingPlotter vs mtr. Against SmokePing, it is quicker to point at a new problem but not built to be a permanent, server-side latency archive. Obkio goes further in the other direction, with agent-to-agent synthetic traffic and central dashboards. The wider field is laid out in the latency and path analysis category.
Getting it safely
Get PingPlotter only from pingplotter.com. The Windows package should carry a valid Authenticode signature from the vendor — right-click, Properties, Digital Signatures, and confirm the signer before running it. On macOS, Gatekeeper will report the developer identity. Avoid bundle sites and “portable” repacks. Our where to get it page covers the general checklist, and our methodology explains how these reviews are researched.
FAQ
Does PingPlotter need administrator rights?
Installation on a managed Windows machine typically needs elevation. Probing afterwards can be limited by endpoint security policy on hardened builds, so test on one machine before rolling it out.
Can it prove the problem is my ISP’s fault?
It can show where loss begins and whether it carries through to the destination, and when. That is strong evidence, not a verdict. If loss starts at your own gateway or on the first hop across Wi-Fi, the fault is local.
Why does one hop show loss while the destination shows none?
That router is deprioritising replies to probes aimed at itself. Traffic passing through it is fine. Only loss that persists from a hop through to the final target indicates a real forwarding problem.
Is the Free edition enough for a one-off ticket?
For a single target and a short look, often yes. The short history and one-target limit make it weak for intermittent issues that take hours to reproduce, which is exactly where the trial of a paid edition is worth running.