A manager forwards an email: “The MPLS link to the warehouse has been worse since the provider’s maintenance window three weeks ago.” Is that true? Without a record from before the change, nobody can say. SmokePing exists for this exact moment. It sits on a Linux box, pings the things you care about all day, every day, and keeps the history long enough that “since three weeks ago” becomes a graph instead of a feeling.
What SmokePing does
SmokePing is a latency-logging and graphing system written by Tobias Oetiker, the author of MRTG and RRDtool. It is written in Perl, stores its data in RRDtool round-robin databases, and presents results through a CGI web front end. By default it probes each target with a burst of pings (commonly 20) every five minutes, then records not just the median but the spread of all the replies.
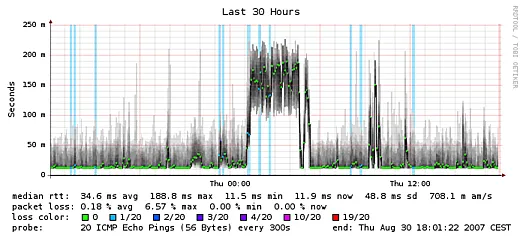
That spread is the signature visual. The median is drawn as a line colored by packet loss, and the other samples are drawn as grey shading above and below it — the “smoke.” A thin haze means stable latency; a tall plume means jitter; a line that changes color means loss. One glance at a week’s graph tells you whether a problem is constant, periodic or a single event.
The probe system is pluggable. Beyond FPing, probes exist for DNS lookups, HTTP(S) through Curl, SSH, TCP connections, and routers that can run pings themselves, so you can measure from the perspective of an actual service rather than only ICMP. Its alarm system can fire on configurable latency and loss patterns, for example “loss above 10% in three consecutive rounds,” and send email or run a script. It can also run in a master/slave arrangement, where several remote probe nodes report back to one central server, so you can compare the same target from multiple vantage points.
The current release at the time of writing is v2.9.0, published in February 2025 after a long gap since v2.8.2 in 2019. It brought SSH probe improvements, IPv6 support in the OpenSSHJunOSPing probe, InfluxDB 2.x fixes and a refreshed interface with an autorefresh toggle.
Where it’s strong: baselines and before/after evidence
SmokePing’s value grows with time. After a month of data, you have a baseline to compare any complaint against, and the graphs make that comparison self-explanatory: pull up the week before and the week after a provider change, place them side by side, and the difference either shows or it does not. For an ISP escalation, a 30-day graph showing a nightly loss plume from 19:00 to 23:00 is harder to dismiss than a single traceroute.
- Cheap to run. A small VM or a Raspberry Pi-class box can watch dozens of targets. RRD files do not grow over time, so disk use is fixed from day one.
- Honest data. Showing the full distribution instead of an average stops jitter from being smoothed away.
- Self-hosted. Nothing leaves your network; useful in environments where cloud monitoring agents need a security review.
- Multi-vantage probing via slave nodes, which helps separate “the target is slow” from “our site’s uplink is slow.”
Where it falls short, and who should skip it
SmokePing is a project you assemble and maintain. You need a Unix-like host, Perl with several modules, RRDtool, fping installed setuid root (or with the right capabilities), and a web server that can run the CGI or FastCGI front end. Distribution packages in Debian, Ubuntu and others make this much easier, but configuration is still a hand-edited text file with a strict hierarchy of sections and targets. Expect to read the documentation.
It is not a troubleshooting tool for the problem happening right now. Default five-minute rounds are too coarse for a 30-second event, and it does not show you the path — for per-hop investigation, run mtr or PingPlotter alongside. It also cannot tell you about throughput or application payloads.
The interface looks dated, access control is whatever you configure on the web server, and there is no vendor to call. Teams that want dashboards, user management and alert routing to Teams or Slack out of the box will find a commercial service such as Obkio less work.
Who it suits
- Admins with a spare Linux VM who want permanent latency history for WAN links, VPN tunnels, upstream gateways and key SaaS endpoints.
- Small ISPs and campus networks that need multi-site vantage points without per-agent fees.
- Anyone who has lost an argument with a provider because they had no “before” data.
Licensing and cost
SmokePing is free software under the GNU General Public License, version 2 or later. There is no paid tier. The real cost is the admin time to install, configure targets and keep the host patched, plus the hardware or VM it runs on.
How it compares
The closest decision is SmokePing versus a hosted agent-based product: see SmokePing vs Obkio for that trade-off in detail. Compared with PingPlotter, SmokePing is server-side and permanent where PingPlotter is desktop-side and investigative. Both appear in the latency and path analysis category, and SmokePing also sits in host and connection checks as a long-running reachability record.
Getting it safely
Install from your distribution’s signed repositories where possible (apt install smokeping on Debian and Ubuntu). For the latest release, obtain the source tarball from the project’s page at oss.oetiker.ch or the oetiker/SmokePing GitHub releases, and compare any published checksum. Put the web front end behind authentication or restrict it to your management network. More on safe sourcing is in where to get it; how we assess tools is on the methodology page.
FAQ
How much history does SmokePing keep?
It depends on the RRA definitions in your config. Typical defaults keep fine-grained data for days and consolidated data for a year or more. Because RRDtool pre-allocates the files, storage is fixed once targets are defined.
Can it probe more often than every five minutes?
Yes. The step and pings settings control the interval and burst size, globally or per probe. Shorter steps give finer resolution but create more probe traffic and, if changed later, require recreating the RRD files.
Does it support IPv6?
Yes, through IPv6-capable probes such as FPing6 and several others. The 2.9.0 release extended IPv6 support in the OpenSSHJunOSPing probe.
Will it alert me in chat tools?
Not natively in the way SaaS products do. Alarms can send email or call an external script, and that script can post to a webhook — a small amount of glue work.